DATA VISUALIZATION
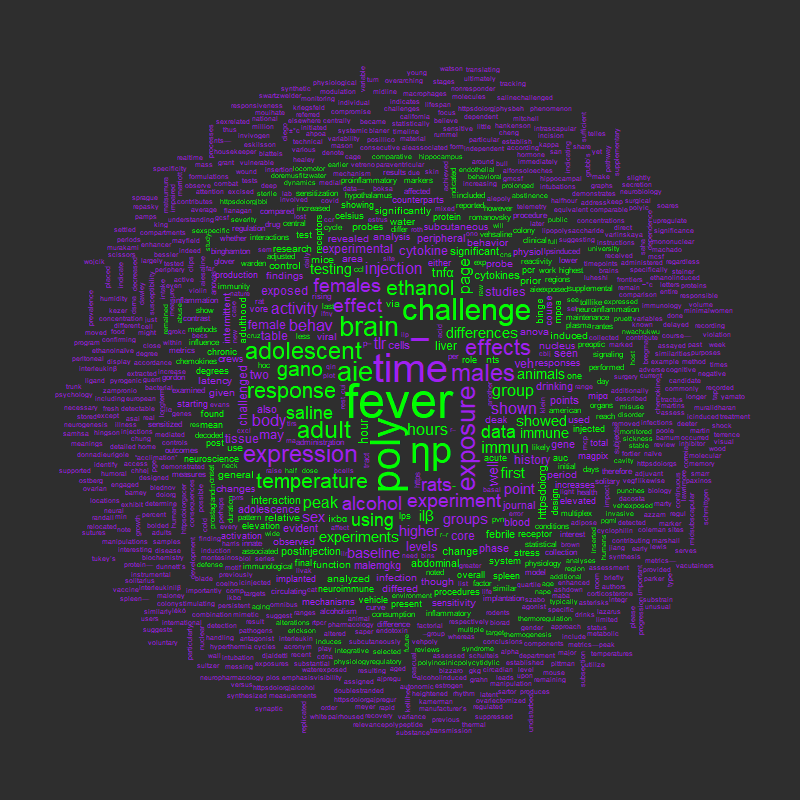
I really love visual representations of data!
Data visualization is the perfect intersection of rigid scientific accuracy and wild creative fancy. At least, it can be.
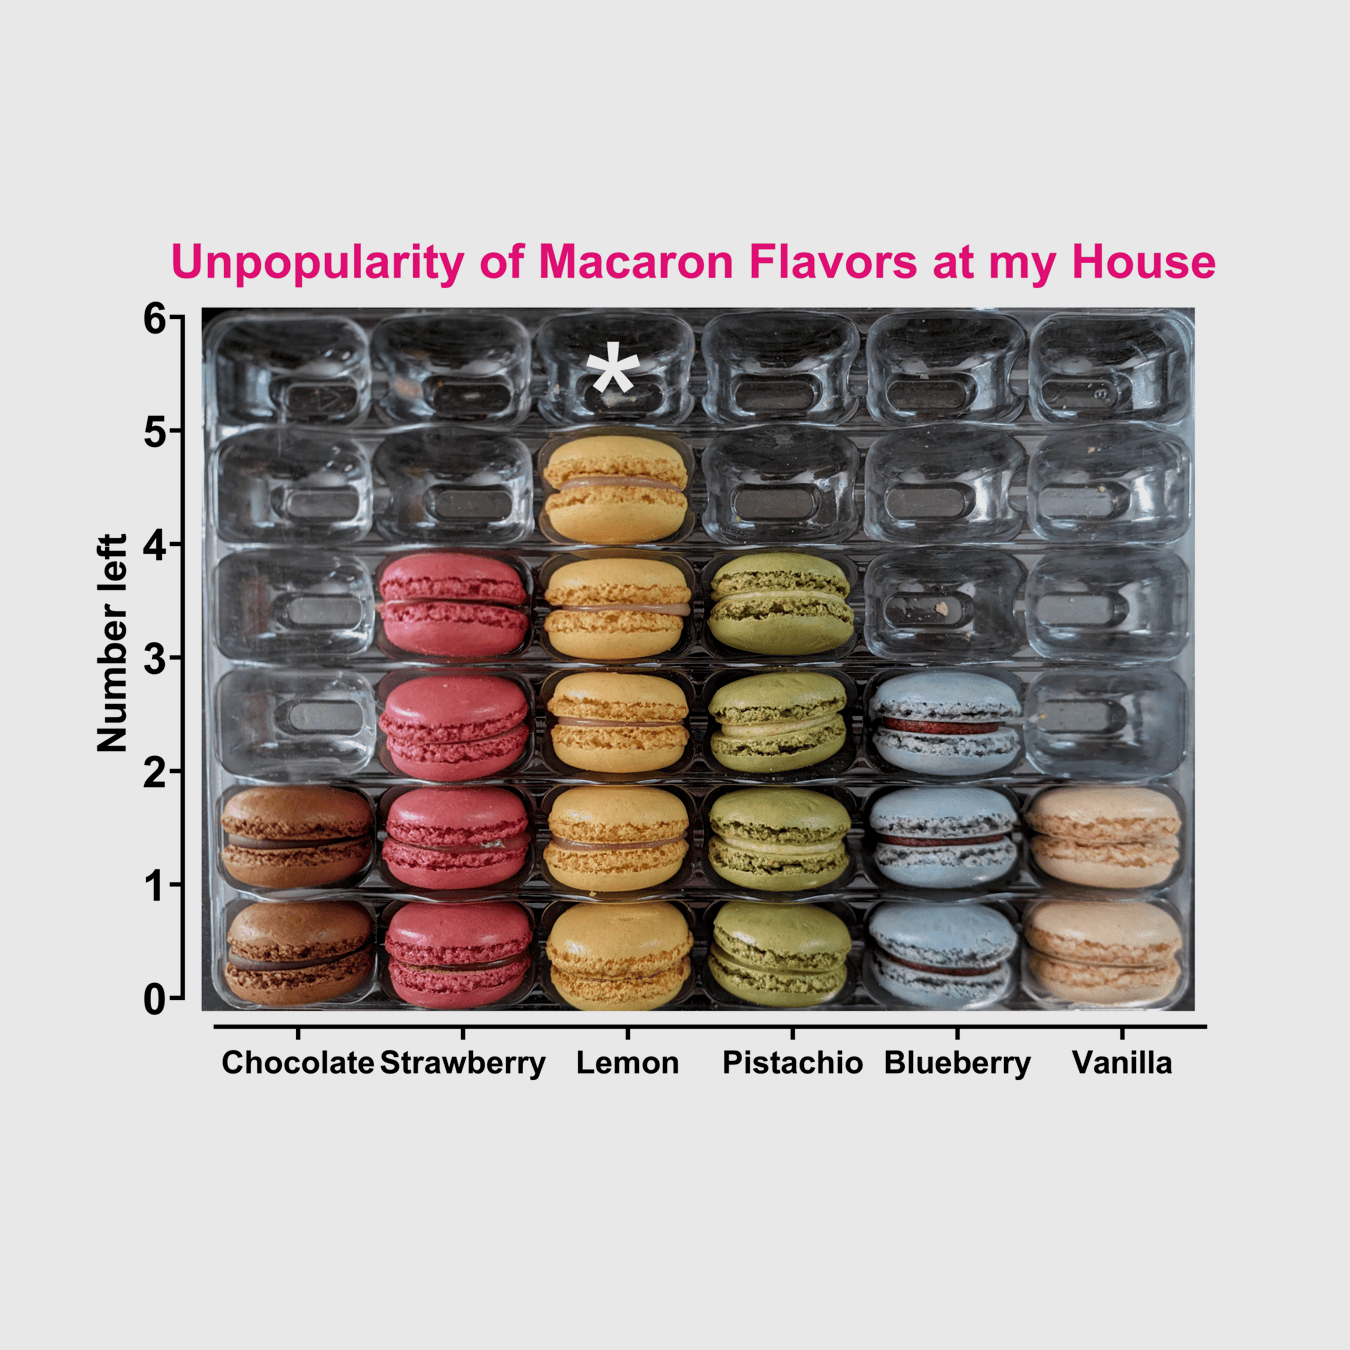
This page will contain a few things: 1) my personal projects – silly graphs done just for fun; and 2) the results (and methods!) of my current quest to learn new graphing techniques using R & Python programming languages.